
SNEAK PEEK
- Bitcoin faces critical support at $27,430-$28,250.
- Bearish momentum strengthens as BTC falls below $29,000.
- Widening Bollinger bands signal rising market volatility for BTC.
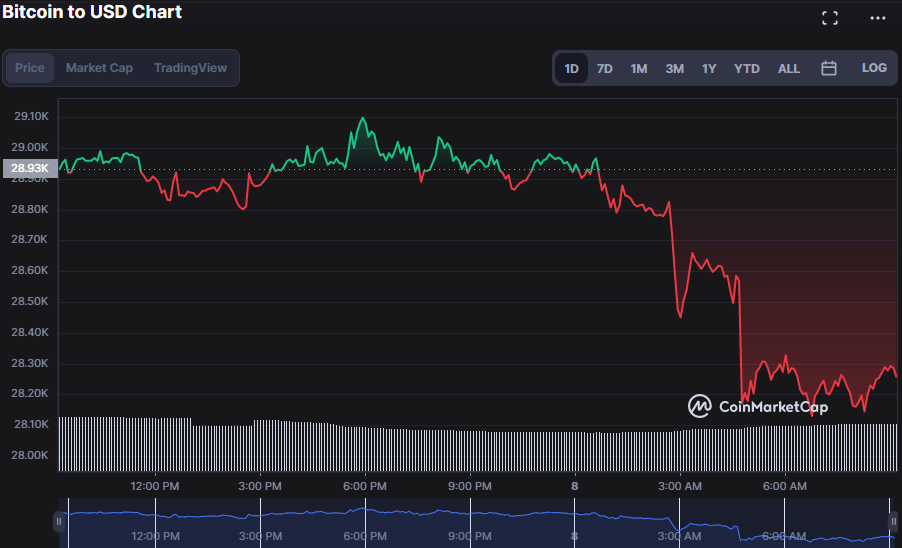
As the Bitcoin market rides through stormy seas, investors closely monitor the critical support level between $27,430 and $28,250. With 1.58 million addresses holding 560,000 BTC in this area, a drop below $24,000-$24,900 is unlikely thanks to this demand wall. However, in the previous 24 hours, the BTC price has fluctuated between a high of $29,119.38 and a low of $28,082.37, with bears holding the upper hand.
The most significant support level for #Bitcoin is between $27,430 and $28,250, where 1.58 million addresses bought 560,000 $BTC. This demand wall must hold to prevent a downswing to $24,000-$24,900.
On the flip side, $BTC needs to break above $29,150 to advance further. pic.twitter.com/gWQmtPwhXl
— Ali (@ali_charts) May 8, 2023
As of press time, BTC was worth $28,216.07, a 2.62% decrease from the previous closing. BTC’s market capitalization and 24-hour trading volume fell 2.57% and 12.09%, respectively, during the bear’s reign, to $546,276,867,955 and $13,199,363,113.
If Bitcoin’s bulls successfully push prices over $29,150, the next important resistance level might be near $30,000.
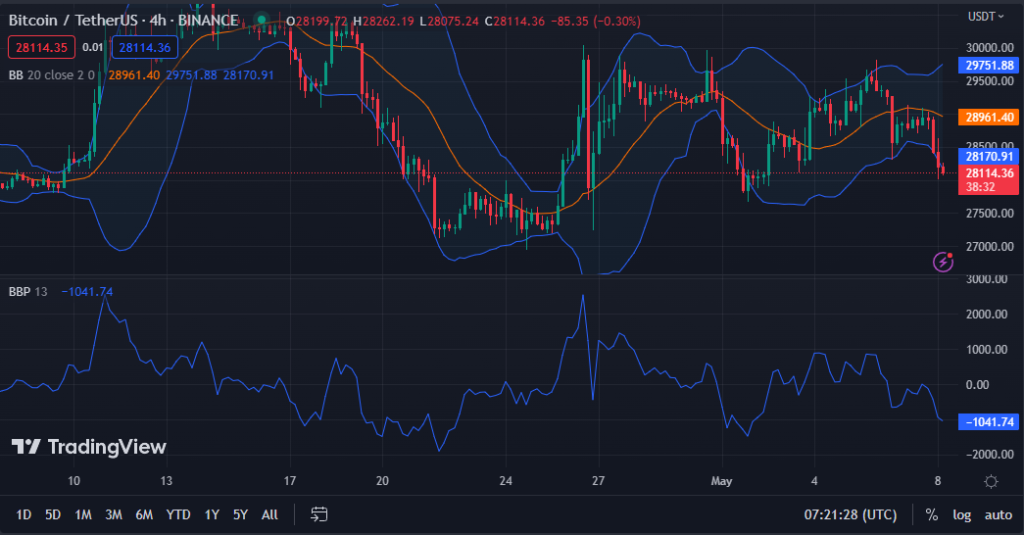
The Bollinger bands on the BTC USDT 4-hour price chart are broadening in the bear market, with the upper and lower bands at $29742.03 and $28185.07, respectively.
This widening shows rising market volatility, which portends more negative pressure. However, the price falls below the bottom band, indicating an oversold position that may result in a short-term comeback.
The Bull Bear Power (BBP) rating of -1042.13 indicates that the bears are in charge of the market and that selling pressure is more significant than purchasing pressure. This move warns traders to wait for a definite reversal trend before purchasing at the lower Bollinger band as a possible entry point.
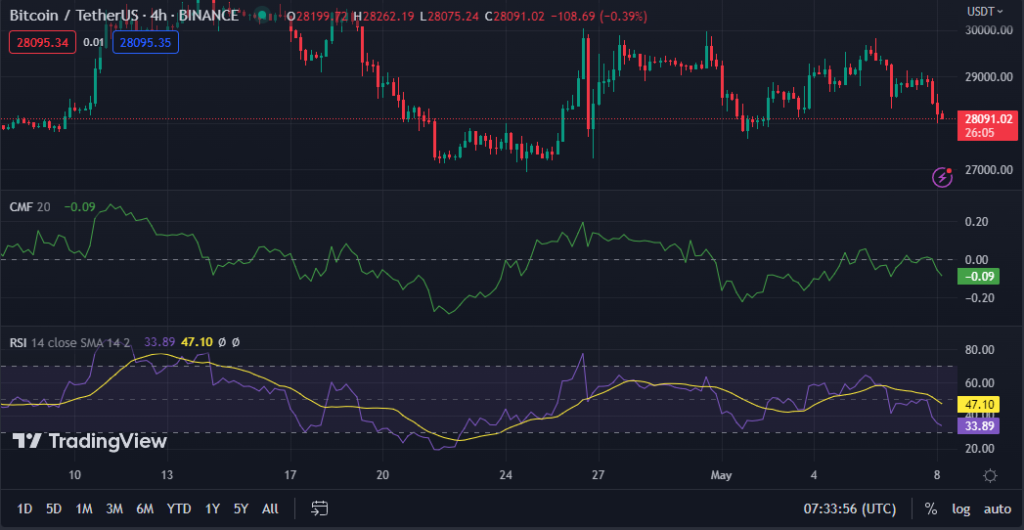
The Chaikin Money Flow (CMF) reading of -0.07 and its southerly direction indicate that a reversal is unlikely and that selling pressure in the market may be rising.
With a Relative Strength Index (RSI) of 34.69 and going below its signal line, the negative momentum is growing, suggesting that the price may fall lower. A reversal is possible if the RSI exceeds 30 (the oversold level).
In conclusion, while critical support levels may prevent a sharp drop in Bitcoin prices, technical indicators suggest that bearish momentum is still strong, and traders should be cautious.
Disclaimer: Cryptocurrency price is highly speculative and volatile and should not be considered financial advice. Past and current performance is not indicative of future results. Always research and consult with a financial advisor before making investment decisions.
