
SNEAK PEEK
Despite the potential magnitude of the simultaneous weekly, monthly, quarterly, and yearly candle closure after a sideways Christmas, the pair disappointed traders on both sides of the trade. A further drop in the BTC market is expected as 2023 begins, but if bulls hang on to the resistance level and drive prices higher, a positive turnaround may be on the radar.

After encountering stiff resistance at $16,628.99, Bitcoin (BTC) prices have progressively retreated to $16,532.90, a 0.18% drop as of press time. The bearish effect displayed on the BTC price chart managed to drive prices down to an intra-day low of $16,517.52 where they found support.
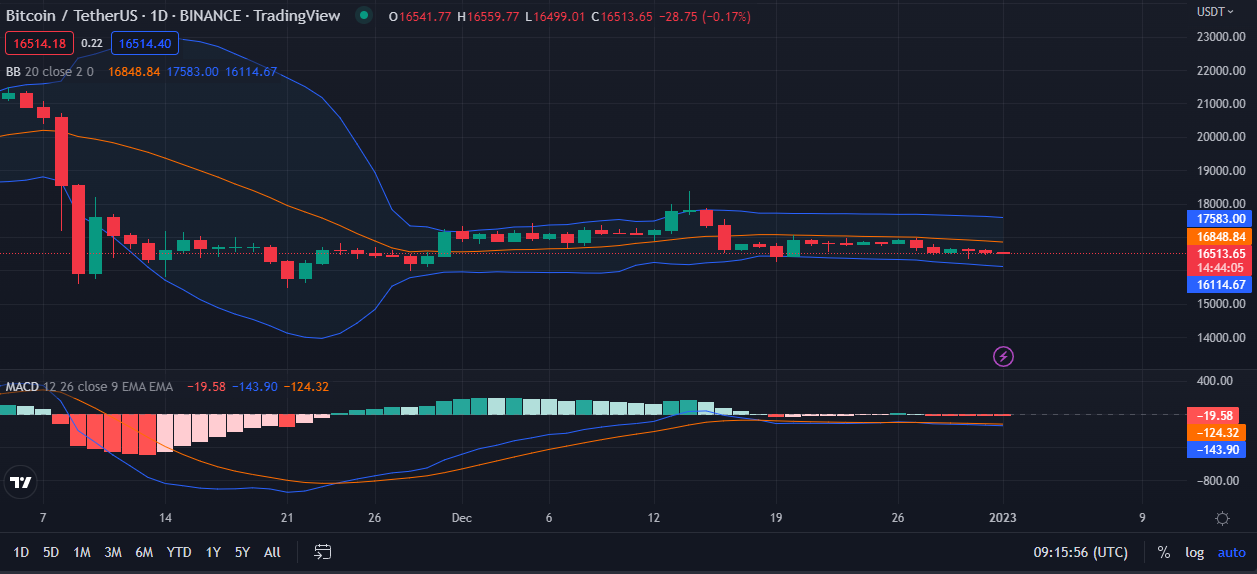
The Bollinger bands are moving linearly on the 24-hour price chart, with the upper band hitting at 17582.98 and the lower band touching at 16114.66. In the short run, these levels serve as immediate resistance and support levels. The BB’s movement suggests that market interest in the BTC market is minimal, forecasting more bear dominance in the market.
The descent of the Moving Average Convergence Divergence (MACD) below the signal and into the negative region with a value of -144.14 adds to this bear momentum. This action reinforces the notion that bear dominance in BTC may endure if bulls do not intervene.
The Bollinger bands are broadening on the 4-hour price chart, with the upper and lower bands touching at $16644.81 and $16479.04, respectively. This movement demonstrates the rising selling pressure as traders sell their shares. The RSI has remained below its signal line, supporting the bearish view on the Bitcoin (BTC) market.
The current trajectory of the MACD blue line above its signal line as it approaches the “0” line, on the other hand, provides some hope for traders, indicating that bulls are still fighting. The tendency of the histogram in the positive zone supports this hypothesis.

In sum, a positive reversal may occur if bulls are able to persist and defend the resistance level ($16,628.99). If bear domain holds, however, a drop below the $16,517.52 support level may send the leading digital currency tumbling to a new low, with the $16479.04 level serving as the next potential bottom.
Disclaimer: In good faith, we disclose our thoughts and opinions in our price analysis, as well as all the facts we give. Each reader is responsible for his or her own investigation. Reader discretion is advised before taking any action.
