
SNEAK PEEK
- Speculative buying has sent the price of helium to a weekly high of $2.04.
- Bulls now rule the HNT market, according to recent statistics.
- HNT price has fluctuated between $1.68 and $2.04 throughout the day.
Helium (HNT) is a cryptocurrency initiative that aims to build a public, distributed ledger (blockchain). Its purpose is to provide for secure and scalable data sharing across private and public networks. The HNT token functions as the platform’s native currency and the means through which the ecosystem is governed.
Investors are drawn to Helium (HNT) because of its affordable price and innovative pricing structure. During the last day, the price of one HNT token has increased from its weekly low of $1.49 to its weekly high of $2.04. At the time of publication, the bulls had pushed the price of HNT up 11.30%, to $1.90.
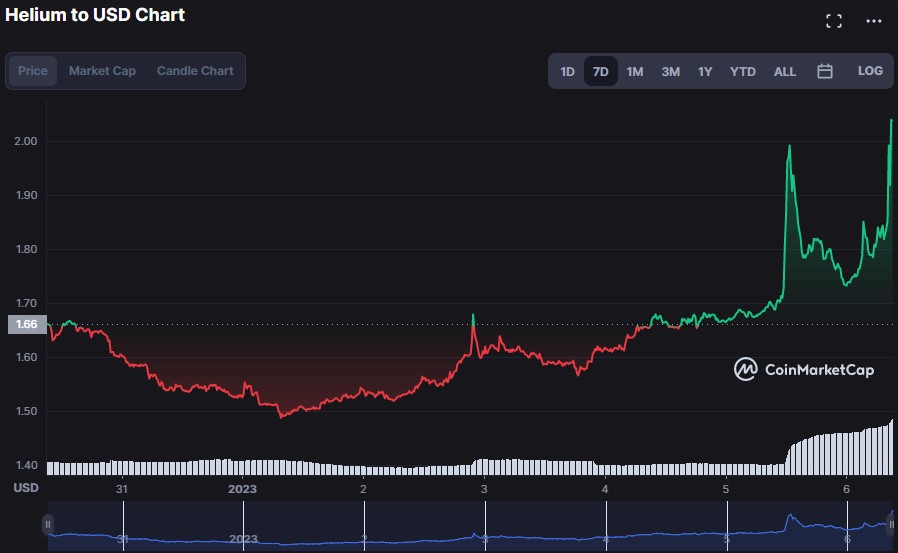
HNT/USD 7-day price chart (source: CoinMarketCap)
Market volatility is reducing as shown by the HNT 24-hour price chart’s Bollinger bands moving linearly and heading southward. Prices of $2.06143 and $1.43565 for the two bands demonstrate this. However, the development of a green engulfing candlestick in the top level suggests that bull vigor is pretty robust and may force prices higher if it persists.
Another indicator suggesting the HNT market’s recent upswing may be short-lived is the Moving Average Convergence Divergence (MACD), which has just moved into the negative territory (now trading at -0.10072).
However, this bleak image is offset by the fact that the blue MACD line has moved above its SMA line and towards the positive zone, and the histogram is moving in the positive region, all of which are indicative of a continuation of the bullish momentum.
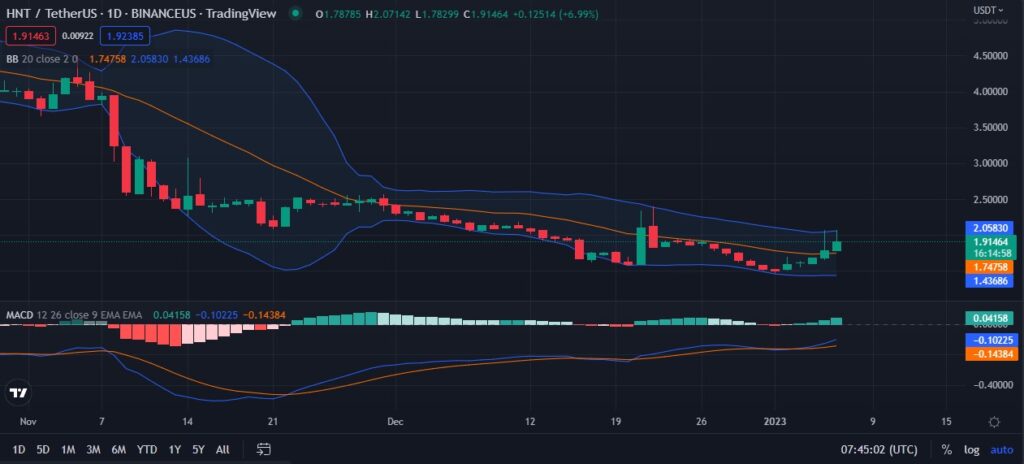
HNT/USD 24-hour price chart (source: TradingView)
Nevertheless, the bullish control is expected to remain in the short term since the Bollinger bands are broadening and heading north, suggesting that market volatility is growing. The top band hits at $1.96292, while the bottom band touches at 1.57355, demonstrating this. This view is supported when the price action moves towards the upper band.
The Moving Average Convergence Divergence (MACD) is presently in the positive zone, trading at 0.06816, indicating that bullish control has been established. The blue MACD line is rising above its SMA line, and the histogram is also moving in the positive region, indicating that bulls still have the upper hand.
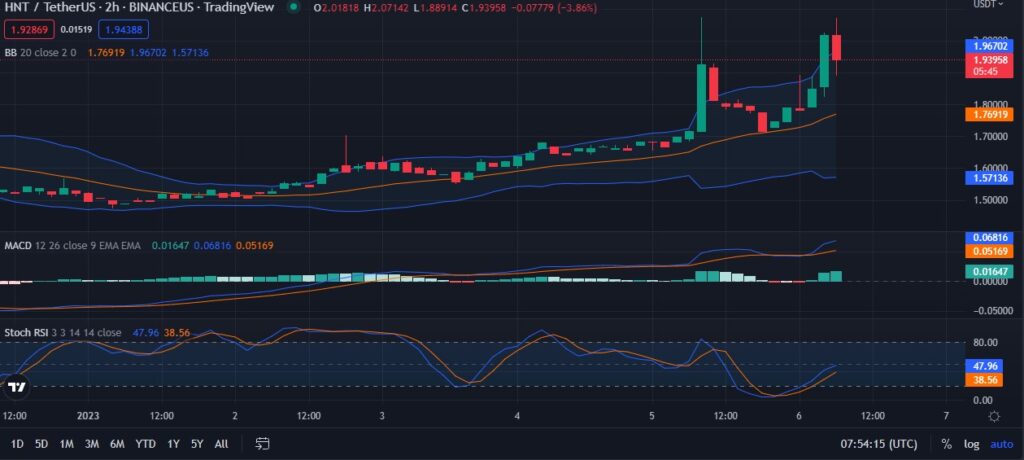
HNT/USD 2-hour price chart (source: TradingView)
If bulls can keep the HNT market under their grip, technical signs point to more gains.
Disclaimer: In good faith, we disclose our thoughts and opinions in our price analysis, as well as all the facts we give. Each reader is responsible for his or her own investigation. Reader discretion is advised before taking any action.
