
SNEAK PEAK
- In the last day, buyers have dominated the Litecoin (LTC) market.
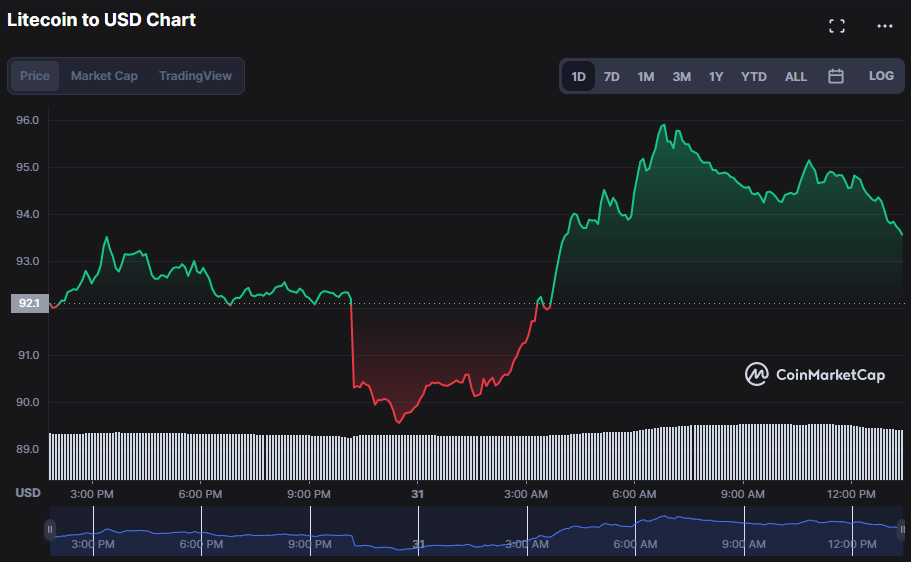
- After reaching $89.50, the bears’ efforts to take the market were thwarted.
- Indicators point to bulls maintaining power in the short run.
Bulls have been in charge of the Litecoin (LTC) price during the last 24 hours, with values fluctuating between $89.50 and $96.00. After the bulls met resistance and were hesitant to push the price higher, the bears briefly took control of the market. However, the bears’ grip was short-lived, and the price promptly rebounded to $93.59, a rise of 1.39%.
The market cap is now $6,755,544,705, up 1.35%, and the 24 hour trading volume is $879,645,883, up 9.26 %. This suggests that investors are still bullish on Litecoin’s long-term potential, since the market was ultimately dominated by purchasing pressure, allowing the upward trend to continue.
Bollinger bands are moving upward, with the upper band at 96.54 and the lower band at 81.95. This indicates that there is an uptrend in the market, as prices are consistently trending higher than the upper band. This movement forecasts the bullish trend in LTC and suggests that investors are bullish in their outlook, as rising Bollinger bands indicate increased buying pressure and bullish sentiment in the market.
The MACD line, which is trending above the signal line in the positive region and has a reading of 2.67, adds to this bullish sentiment, as the positive reading indicates that momentum is strongly in favor of buying rather than selling and that prices are likely to continue to trend higher.
The positive reading of the RSI indicator, which is currently at 68.7, adds to this outlook. This shift indicates that traders and investors are still optimistic about LTC’s future appreciation, both in the near and distant future.

The 1-day price chart’s presence of a sizable green candlestick is additional evidence of the bullish dominance of the previous 24 hours. As long as demand is high and momentum is rising, Litecoin prices should continue to rise.
This viewpoint is supported by the BB bands, where the indicator’s center line has been creeping higher in tandem with the price action. The RSI, a price momentum indicator, remains relatively high, lending credence to this viewpoint. However, because it suggests that the market is overbought, traders are advised to proceed with caution.
The Litecoin moving average convergence divergence (MACD) is increasing and is now well above the signal line, indicating that the market is optimistic.This move further backs the bullish momentum in the LTC market persistence.

Maintaining resistance levels and driving LTC prices higher is necessary for bulls to keep their grip on the market.
Disclaimer: In good faith, we disclose our thoughts and opinions in our price analysis, as well as all the facts we give. Each reader is responsible for his or her own investigation. Reader discretion is advised before taking any action.
