
SNEAK PEEK
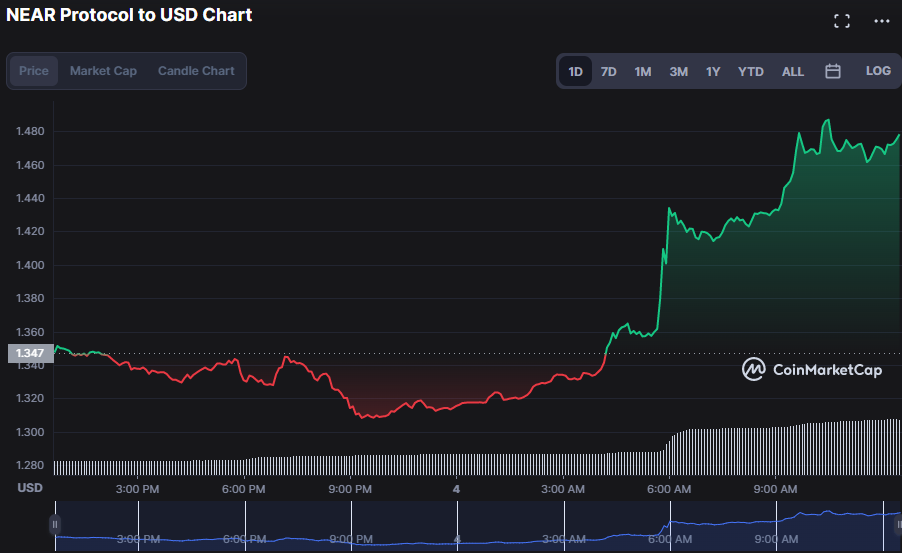
The NEAR Protocol (NEAR) has resumed its uptrend after finding support around $1.31 in the past day. Market capitalization increased by 12.61% to $1,280,121,023 and 24-hour trading volume increased by 421.59% to $191,443,182, respectively, indicating strong market interest in NEAR.
Recent hours have seen a bullish upsurge that has pushed the price of NEAR Protocol from $1.31 to $1.51, a gain of 12.69%.
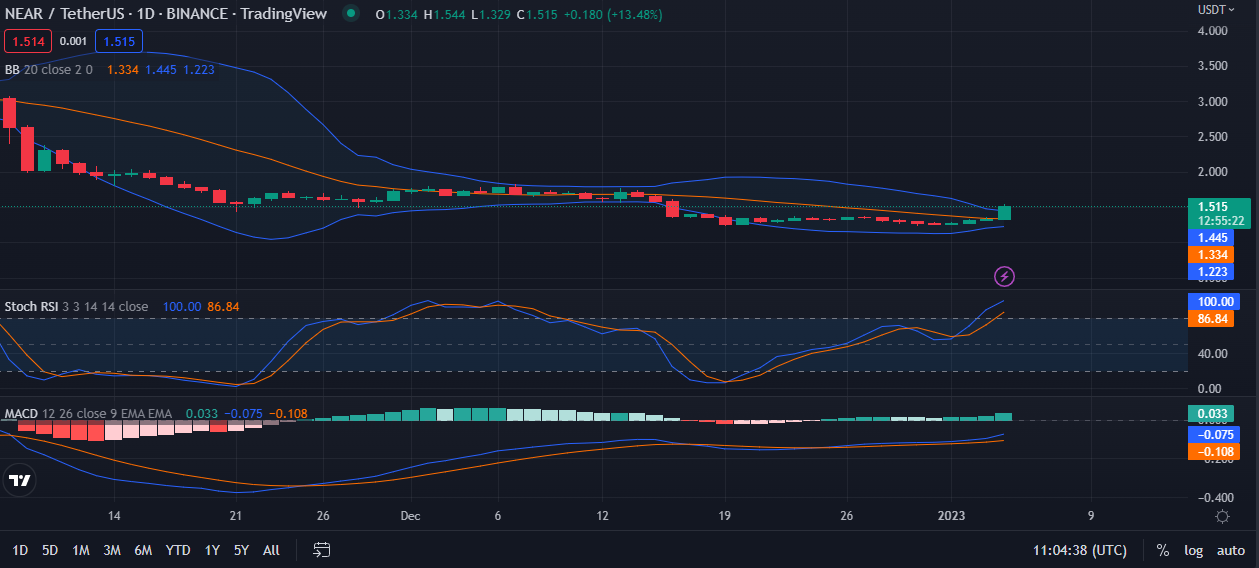
On the NEAR 24-hour price chart, the Bollinger bands are narrowing, indicating that market volatility is decreasing. This is shown by the bands’ prices of $1.444 and $1.223, respectively. Even so, the development of a bullish engulfing candlestick (green) above the upper range implies that bull strength is fairly strong and may propel prices higher if it sustains.
However, the overbought signal on the stochastic RSI should serve as a warning to traders (100.00). While this pattern indicates that bulls’ strength is at an all-time high, it also warns traders that the current upswing might be coming to an end.
The Moving Average Convergence Divergence (MACD) is now in the negative area, trading at -0.075, which is another warning sign for investors that the NEAR market’s positive trend may be temporary. This negative picture is softened, however, since the blue MACD line is rising above its SMA line and into the positive zone, and the histogram is also trending in the positive territory.
Because the lower band has touched $1.501 and the upper band has touched $1.227 on the 2-hour price chart, the Bollinger bands are expanding, signaling that market volatility is rising. But the appearance of a red bearish engulfing candlestick above the upper range is a warning sign that bull vigor is diminishing.
The overbought signal on the stochastic RSI adds to the warning (96.17). In spite of the fact that this pattern shows that bulls’ strength is high, the fact that it is moving below its signal line suggests selling pressure is outweighing purchasing pressure, which should alert traders to the possibility of a reversal.
However, with the MACD trajectory in the positive zone and a value of 0.048, the bulls seem to be in charge, giving traders some insight into the possibility of a sustained bull run.

Technical indicators for the NEAR market hint at more increases if bulls are able to maintain control over the market.
Disclaimer: In good faith, we disclose our thoughts and opinions in our price analysis, as well as all the facts we give. Each reader is responsible for his or her own investigation. Reader discretion is advised before taking any action.
