
SNEAK PEEK
- Bitcoin whales remain optimistic with steady accumulation.
- Bearish pressure signals potential price decline.
- Bearish pressure mounts, urging traders to consider short positions.
Even though prices have remained unchanged for the past five weeks, Bitcoin’s (BTC) top large whale address tier has been steadily building up its holdings, accumulating a combined 84,897 BTC. Prices increased by +34.4% in their prior accumulation cycle in January. This implies that these whales believe in Bitcoin’s long-term potential and are prepared to keep their investments despite brief price fluctuations.
? #Bitcoin‘s key large whale addresses tier has been on a steady accumulation run over the past 5 weeks, accumulating a combined 84,897 $BTC during this time while prices are stagnant. In their previous accumulation cycle in January, prices jumped +34.4%. https://t.co/fLhCcBOJZA pic.twitter.com/sV43UxGksj
— Santiment (@santimentfeed) May 16, 2023
However, bears have taken control of the Bitcoin market in the past 24 hours, driving prices from an intraday high of $27,285.61 to an intraday low of $26,910.20. As of this writing, BTC was trading at $26,956.06, a 0.45% decrease from its previous close.
BTC’s market capitalization and 24-hour trading volume decreased by 0.45% and 4.53%, respectively, to $522,294,135,511 and $12,241,197,390. This decline can be attributed to investors’ uncertainty and caution as they watch the BTC market carefully and hold off on making sizable investments until they see a recovery.

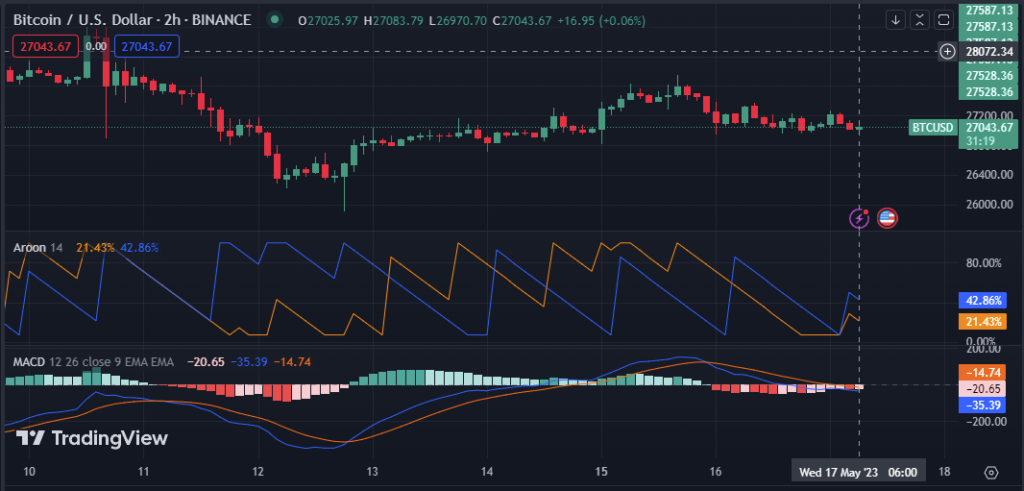
The Aroon up and down readings are 21.43% and 42.86% on BTC’s market price chart, indicating strong bearish pressure, which could soon result in further price declines. Traders should focus on these readings and consider opening short positions or liquidating their current holdings.
On the 2-hour price chart, the MACD blue line, which runs below its signal line, has a value of -35.39 and is oriented southward, pointing to a downward trend in the BTC market. The market may be experiencing a downturn, and investors may want to consider selling their assets or delaying further investments until the trend changes.
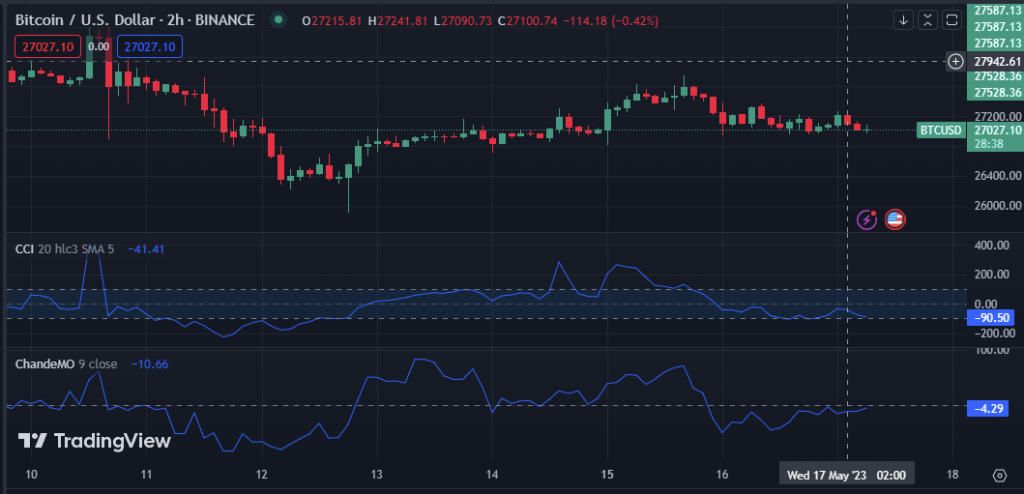
The Commodity Channel Index (CCI), which has a line pointing south and a value of -90.50 on the 2-hour price chart, is in negative territory, pointing to a possible oversold situation. This suggests that the market is moving in a bearish direction, so traders should exercise caution when taking long positions.
The Chande Momentum Oscillator (ChandeMo) is in the negative region on the 2-hour price chart of the BTC market with a reading of -4.29. This move shows that the market is in a bearish trend currently and that there might be more rapid downward movement.
In conclusion, the Bitcoin market faces uncertainty as whales remain optimistic, but bearish pressure mounts. Traders should exercise caution and consider short positions in the current downward trend.
Disclaimer: Cryptocurrency price is highly speculative and volatile and should not be considered financial advice. Past and current performance is not indicative of future results. Always research and consult with a financial advisor before making investment decisions.
