
SNEAK PEEK
- LTC’s halving event nears, boosting bullish breakout chances as volatility rises.
- Strong positive momentum in the LTC market, attracting investor interest.
- Increasing trading volume signals LTC’s potential as an investment strategy.
According to a recent tweet, less than 350 blocks remain until the halving, as the event will occur in less than a day. The price was closer to breaching the falling wedge after remaining within the consolidation for over 27 days. However, the token’s volatility has risen significantly and has been trading within large ranges. Hence, the probability of a bullish breakout after the halving event is raised.
350 Blocks remaining! pic.twitter.com/aBMK6sf4do
— Litecoin (@litecoin) August 2, 2023
Consequently, in the last 24 hours, the Litecoin (LTC) market has displayed strong positive momentum, with unsuccessful attempts to lower prices. Support was observed at $90.00 during this upward movement, and resistance was seen at $94.31. As a result, LTC has witnessed a 1.09% rise compared to its previous closing price, reaching $91.47.
LTC saw a 1.82% rise in market capitalization, reaching $6,722,999,463. Simultaneously, its trading volume experienced a significant surge of 29.29%, amounting to $747,982,498. This increase indicates a growing interest in LTC as a potential investment strategy.

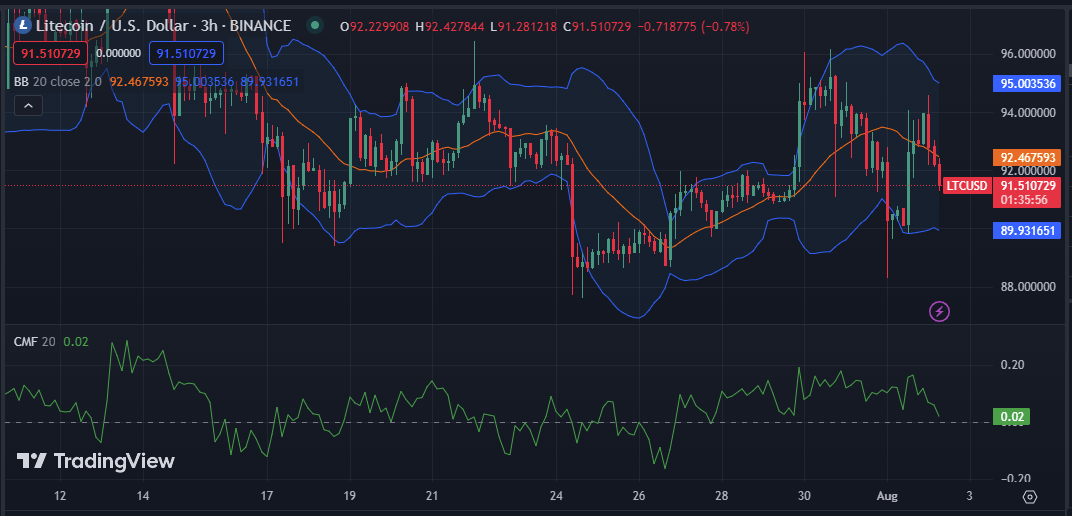
On LTC’s 3-hour price chart, the positive Chaikin Money Flow (CMF) value of 0.02 suggests that the coin’s future performance could be promising. A positive CMF signifies that more capital flows into LTC than out, indicating that investors are purchasing more LTC tokens than they are selling.
The Bollinger bands in the market are bulging, with upper readings at 95.000536 and lower readings at 89.931651. This motion signals high volatility in the market; hence traders should be prepared for significant price fluctuations soon. The difference of 5.068885 between the upper and lower bands indicates a moderate level of market volatility.
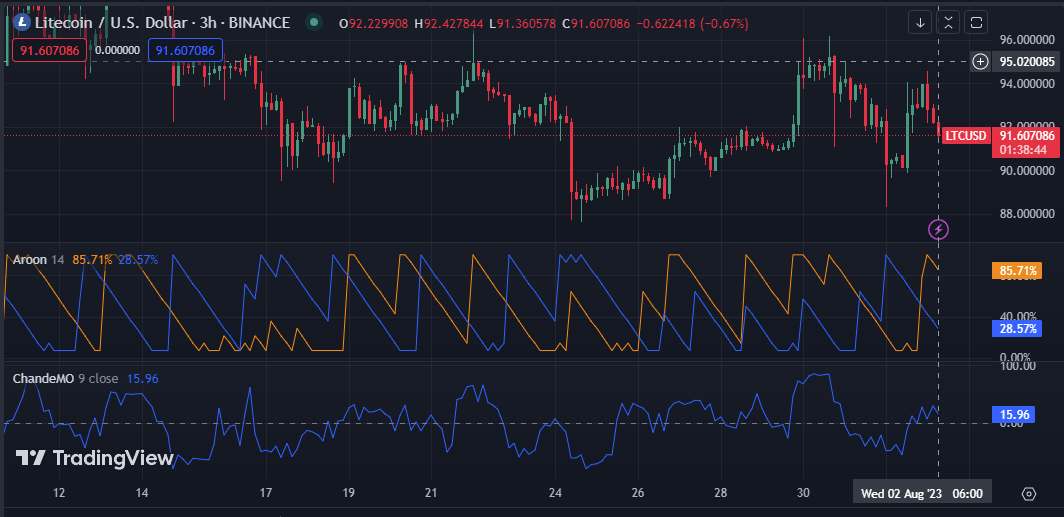
On the 3-hour price chart, the Aroon up and down values are 85.71% and 28.57%, respectively. This move shows that the trend is strong and likely to last for a while, despite the risk of minor reversals. This enables traders to identify probable entry and exit points for trades.
The Chande Momentum Oscillator (ChandeMo), which has a positive value of 15.96 on the 3-hour price chart of LTC, heads north. The bullish trend and high momentum show buyers are in charge of the market, and LTC prices will likely rise soon.
In conclusion, LTC’s halving event fuels investor interest as prices surge, signaling the potential for a bullish breakout and a promising investment opportunity.
Disclaimer: Cryptocurrency price is highly speculative and volatile and should not be considered financial advice. Past and current performance is not indicative of future results. Always research and consult with a financial advisor before making investment decisions.
